bulk RNA-seq(2):Quality Control with FastQC and MultiQC
FastQC for Quality Checks
FastQC provides a simple way to perform quality control checks on raw sequence data. Visit the FastQC homepage for download instructions and more information.
Installing Java Runtime Environment (JRE)
FastQC requires Java to run. Install JRE using the command:
sudo apt install default-jre
Verify the installation by checking the Java version:
java -version
Installing FastQC
To install FastQC, enter the following commands:
sudo -i
apt install fastqc
fastqc -version
Running FastQC
Execute FastQC on all .gz files in the directory:
fastqc *.gz
This command analyzes all .gz files, producing an HTML report (XXXX_fastqc.html) for each sample, summarizing the quality metrics.
Interpreting FastQC Results
After running FastQC, you will receive an HTML report for each sample, which provides a comprehensive overview of various quality metrics. Understanding these metrics is crucial for assessing the quality of your RNA-seq data. Here’s a brief guide to interpreting some key sections of the FastQC report:
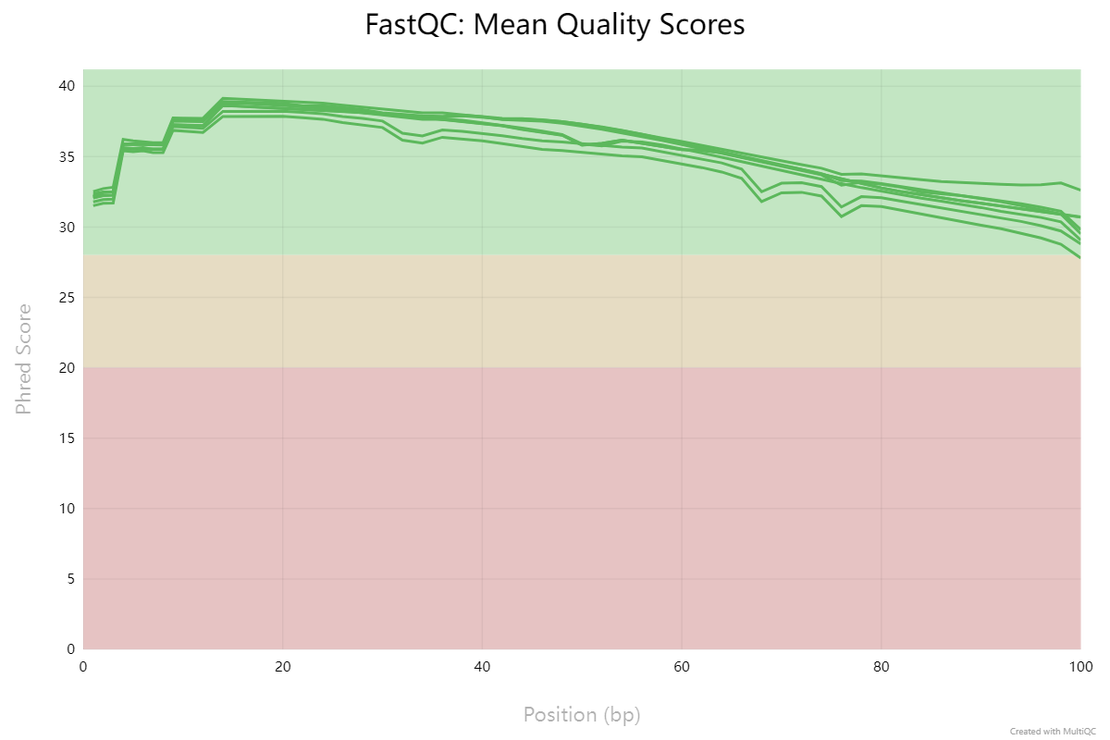
1. Per Base Sequence Quality
This section displays the quality scores across all bases at each position in the reads. Ideally, you want to see most of your reads with high scores (green and yellow), indicating reliable base calls. A drop in quality towards the end of reads is common, but significant quality drops may necessitate trimming.
2. Per Sequence Quality Scores
This graph shows the distribution of average quality scores across all reads. A left-skewed graph towards higher quality scores is desirable, indicating that most of your reads are of high quality.
3. Per Base Sequence Content
Examines the proportion of each base (A, T, C, G) at each position across all reads. In RNA-seq data, some variation at the beginning of reads is expected due to random hexamer priming in library preparation, but consistent biases or deviations in later positions may indicate contamination or other issues.
4. Per Sequence GC Content
This plot displays the distribution of GC content across all reads and compares it to a theoretical distribution. A significant deviation from the theoretical curve can suggest contamination or biased library preparation.
5. Sequence Duplication Levels
High levels of duplication can indicate over-amplification of certain regions. Some duplication is expected, especially in RNA-seq data, due to the nature of transcript abundance. However, unusually high duplication levels may warrant further investigation.
6. Overrepresented Sequences
Identifies sequences that appear more often than statistically expected. This could be a sign of contamination or highly abundant transcripts. It’s important to evaluate whether these overrepresented sequences are expected or indicative of an issue with the sample.
7. Adapter Content
Checks for the presence of adapter sequences. While some adapter contamination is expected, especially in shorter reads, significant adapter content may affect analyses and could require read trimming.
MultiQC for Aggregated Reports
MultiQC compiles results from various bioinformatics analyses, including FastQC, into a comprehensive report, streamlining quality assessment across multiple samples.
installing conda
Conda is an open-source package management and environment management system that simplifies package installation and management. For detailed installation instructions, visit the Conda installation guide .
Setting Up Python Environment
Create and activate a new Python environment using Conda to ensure compatibility and manage dependencies effectively:
conda create --name py3.7 python=3.7
conda activate py3.7
python -version
Installing MultiQC
conda install -c bioconda -c conda-forge multiqc
Running MultiQC
multiqc . # Analyze all FastQC result files (.html) in the current directory
Interpreting MultiQC Results
The MultiQC report provides an at-a-glance summary of quality control metrics for all samples, enabling rapid identification of potential issues:
- Summary Table: Displays a high-level overview of QC metrics for each sample. Look for any warnings or failures that may require attention.
- FastQC Modules: Aggregated results of key FastQC metrics, such as “Per Base Sequence Quality” and “Sequence Duplication Levels”, across all samples. Consistency in quality across samples can be easily assessed here.
- Adapter Content: Provides a summary of adapter sequence contamination across samples. High levels of adapter content in multiple samples may indicate the need for adapter trimming.
- Overrepresented Sequences: Identifies common sequences across samples, useful for spotting contamination or highly abundant sequences.