What is the RNA-seq analysis?
Overall description of RNA-Seq
The transcriptome has a high degree of complexity including multiple types of coding and non-coding RNA species, like mRNA, pre-mRNA, microRNA, and long ncRNA. To understand how the expression of a gene affects translation to proteins, messenger RNA (mRNA) molecules were the most frequently studied RNA species. Besides coding RNA, noncoding RNA molecules also play significant roles in cellular functions: Ribosomal RNAs and transfer RNAs are involved in mRNA translation. Small nuclear RNA (snRNAs) are involved in splicing. MicroRNA (miRNA) and piwi-interacting RNA (piRNA) regulate gene expression at the posttranscriptional level…
The development of high-throughput next-generation sequencing (NGS) has revolutionized transcriptomics by enabling RNA analysis through the sequencing of complementary DNA (cDNA). This method is termed RNA sequencing (RNA-Seq).
Understanding the Pandora box of the transcriptome is the key to connecting the information in our genome with its functional protein expression. RNA-seq analysis allows us to understand which genes are turned up/down in a cell/tissue, what their level of transcription is, and such changes-indicated diseases.
RNA-Seq can be applied to investigate different populations of RNA, including total RNA, pre-mRNA, and noncoding RNA, such as microRNA and long ncRNA.
An RNA-seq workflow has several steps, which can be summarized as:
RNA extraction
Reverse transcription into cDNA (cDNA library preparation)
Adapted ligation
Amplification
Sequencing
1. RNA extraction
Overview of RNA-seq (Kimberly.KR et al.,Cold Spring Harb Protoc. 2015 )

The first step in transcriptome sequencing is the isolation of RNA from a biological sample as the above figure shows. To ensure a trustable RNA-seq experiment, the RNA needs to have sufficient quality to produce a library for sequencing.
Certain forms of contamination can be detected using UV spectroscopy and the calculation of absorbance ratios. Good quality RNA will have an A260/280 ratio of 1.7 to 2.1 and A260/230 of 2.0 to 2.2. A260/280 lower than 1.7 may indicate protein contamination, whereas A260/230 less than 1.8 may indicate the presence of organics (e.g. phenol or guanidine) leftover from the extraction protocol. Such contaminants may interfere with library preparation.
The measurement of RNA quality was usually performed by Agilent bioanalyzer: RNA Integrity Number (RIN).
RIN assigns an electropherogram a value of 1 to 10, with 10 being the least degraded, the best quality. RIN represents the ratios of 28S to 18S ribosomal bands. The figure below shows the ideal fluorescence-length graph of RIN 10.

Info
The total RNA ratio is calculated by taking the ratio of the area under the 18S and 28S rRNA peaks to the total area under the graph, a large number here is desired, indicating much of the rRNA is still at these sizes and thus little to no degradation has occurred. An ideal ratio can be seen in the above figure, where almost all of the RNA is in the 18S and 28S RNA peaks. A small marker height is desired, indicating only small amounts of RNA have been degraded and proceeded to the smallest lengths. If marker > 18S or 28S, meaning RNA has been greatly degraded.
Here is the sample RIN quality control graph. Most of the RINs are around 9, which means good quality of RNA.

2. Library preparation
In the next step, we need to choose an appropriate library preparation protocol———-select RNA species!
For eukaryotic systems, researchers have a choice between poly(A) selection or rRNA depletion for enriching non-ribosomal RNA during library preparation. Prokaryotes require rRNA depletion methods as their mRNA is not polyadenylated. The decision tree in Figure 10 can help guide the selection of an enrichment method. Reference

Basically, if the rRNA transcripts are not removed before library construction, they will consume the bulk of the sequencing reads, thus limiting the detection of DEGs.
2.1 Poly(A) selection

In a eukaryotic cell, 80% of the total RNAs are ribosomal RNA (rRNA), whereas the other 5% is polyadenylated positive (poly(A)+ ) mRNA. Poly(A) selection is the most common method for library preparation to provide efficient enrichment of poly(A) + transcripts including mRNAs and many non-coding RNAs, and also reduces the amounts of pre-mRNAs. In this approach, the 3′ poly-A tail of mRNA molecules is targeted using poly-T oligos that are covalently attached to a given substrate (e.g., magnetic beads).
2.2 rRNA depletion
rRNA-depleted removes cytoplasmic and mitochondrial rRNA and thus includes poly(A) + mRNA, as well as non-coding RNAs or protein-coding mRNAs that are not polyadenylated. In eukaryotes, this technique allows researchers to study both coding and non-coding transcripts.
In a previous study, the researchers showed that rRNA depletion captured more unique transcriptome features, whereas polyA+ selection outperformed rRNA depletion with higher exonic coverage and better accuracy of gene quantification. Reference

3. Sequencing

In RNA-seq sequencing, there are paired-end sequencing and single-end sequencing.
Paired-end sequencing is usually recommended for most applications as it provides richer data and permits longer library insert sizes. Paired-end sequencing allows us to sequence both ends of a fragment and generate high-quality, alignable sequence data.
For a single-read run, one Read 1 (R1) FASTQ file is created for each sample per flow cell lane. For a paired-end run, one R1 and one Read 2 (R2) FASTQ file is created for each sample for each lane. FASTQ files are compressed and created with the extension *.fastq.gz.
Currently, the Illumina HiSeq platform is the most commonly applied next-generation sequencing technology for RNA-Seq and has set the standard for NGS sequencing. The platform has two flow cells, each providing eight separate lanes for sequencing reactions to occur.
Normally, we will get 8 read files (.fastq) for one sample. Each sample run in 4 separate lanes with paired-end:
XXX_L001_R1_001.fastq
XXX_L002_R1_001.fastq
XXX_L003_R1_001.fastq
XXX_L004_R1_001.fastq
XXX_L001_R2_001.fastq
XXX_L002_R2_001.fastq
XXX_L003_R2_001.fastq
XXX_L004_R2_001.fastq
So, we need to catthe files together into one.
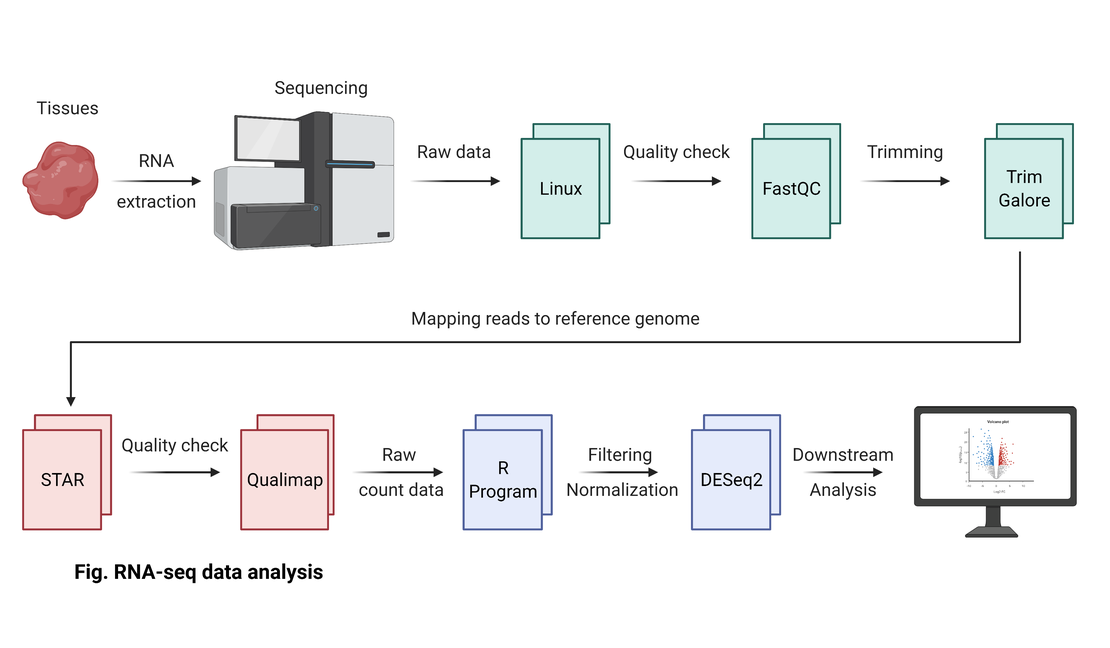
4. RNA-seq data analysis

My RNA-seq analysis workflow is based on this figure. For more information, please refer to my other articles.